
Advanced Spreadsheets
Lesson 5 – Data Management: Tables, Sorting, Filtering and Subtotals
This lesson covers structured tables, advanced sorting and filtering, subtotals, and basic data validation. These skills help you manage and analyse larger data lists safely and efficiently.
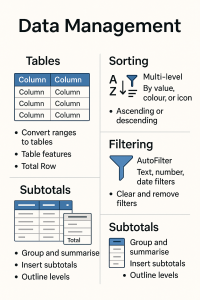
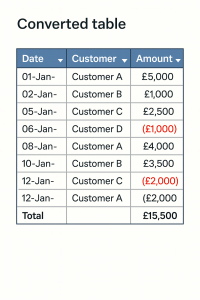
1. Converting ranges to tables
Structured tables make it easier to sort, filter and summarise data. They also expand automatically as new rows are added.
- Convert a data range to a recognised table using the built-in table feature.
- Use table features such as automatic headers, banded rows, and filter buttons on each column.
- Apply different table styles to improve readability, then remove or change styles where necessary.
- Add a Total Row and use built-in summary functions like Sum, Average, Count.
2. Advanced sorting
Sorting reorganises your data to make patterns easier to see. Advanced sorting lets you sort on more than one field and even by colours or icons (where supported).
- Sort by a single field, such as sorting Sales in descending order.
- Apply a multi-level sort (for example: first by Region, then by Sales within each Region).
- Sort by values, cell colour, font colour or icon (where supported in your spreadsheet application).
- Always ensure that the entire list is included in the sort to avoid misaligned or corrupted data.

3. Advanced filtering
Filtering shows only the rows that meet given criteria, while hiding the others. This is useful when working with large datasets.
- Apply AutoFilter to a data range or table to add filter arrows to each column.
- Filter by:
- Specific values (for example, only show Region = North).
- Text conditions (Contains, Begins with, Ends with).
- Number conditions (Greater Than, Less Than, Between).
- Date conditions (This Month, Last Year, Before / After a specified date).
- Clear individual column filters or remove all filters to return to the full dataset.
- Remove filter arrows when filtering is no longer required.

4. Subtotals
Subtotals calculate summary values for groups within sorted data, such as totals per department or region.
- Sort the data by the field you want to group by (for example, Department or Category).
- Use the Subtotal tool to insert subtotals at each change in the grouping field.
- Select from functions like Sum, Average, Count, Min, Max and others.
- Use outline levels to expand or collapse detail rows, showing only grand totals or group totals as needed.
- Remove all subtotals once the analysis is complete, especially before applying other sorts or filters.

5. Basic data validation
Data validation helps prevent incorrect entries and guides users when they type data into a worksheet.
- Restrict entries to whole numbers or a numeric range (for example, 0–100 for a percentage score).
- Restrict entries to dates within a specified period (such as this financial year).
- Use list validation to provide a drop-down list of allowed values (for example, Status = Open, Closed, Pending).
- Set input messages that appear when a user selects a cell, explaining what should be entered.
- Set error alerts to display a warning or stop message when invalid data is entered.

6. Good practice
Good data management practices help keep spreadsheets reliable and easier to use.
- Maintain a single header row and avoid blank rows or columns inside the data area.
- Use tables for data that will be sorted, filtered or analysed regularly.
- Store related data in one continuous block so that filters, sorts and subtotals work correctly.
- Record which filters and sorts were used when producing reports so that results can be reproduced or checked.

7. Practical Activity
Complete this activity to apply the lesson skills.
- Open a worksheet containing an existing data range (for example, a sales or orders list).
- Convert the data range to a table and apply a suitable table style.
- Add a Total Row and choose an appropriate summary function for a numeric column (such as Sum of Amount).
- Apply a multi-level sort (for example, first by Region, then by Sales within each region).
- Use filters to display only records above a target value (for example, Sales >= 10,000) or for a particular region.
- On a copy of the data (or after clearing filters), use the Subtotal tool to insert subtotals by Category or Department and practise expanding/collapsing the outline.
- Create a simple data validation list for a Status column (for example, Pending, Shipped, Cancelled) and test the input and error messages.
| Product | Category | Region | Sales (£) |
|---|---|---|---|
| Laptop | Electronics | North | 1,500 |
| Microwave | Home | South | 1,000 |
| Sofa | Home | North | 2,400 |
| Printer | Electronics | East | 800 |
| Desk Chair | Office | West | 750 |
| Refrigerator | Home | South | 1,950 |
| LED TV | Electronics | North | 2,750 |
| Filing Cabinet | Office | East | 900 |