
Advanced Module – Databases (Access)
Lesson 7 – Advanced Reports and Output
This lesson focuses on creating professional reports that group, summarise and present data clearly for printing or PDF export. Reports allow you to prepare business-ready documents using data stored in your database.
1. Creating reports
- Select a table or query in the Navigation Pane.
- Choose Create > Report for an automatic layout, or use Report Wizard to control grouping, sorting and fields.
- Use Layout View for quick visual adjustments, or Design View for advanced editing of sections and controls.
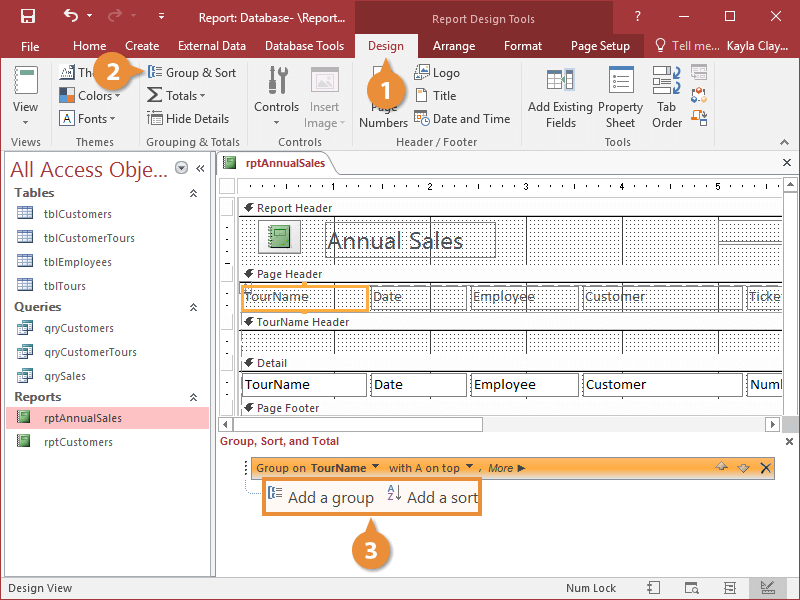
2. Grouping and sorting in reports
Grouping organises information, making reports easier to read—for example, grouping orders by Customer or by Month.
How to add grouping and sorting
- Open the report in Layout View.
- Select Group & Sort from the ribbon.
- Add a group on a field (e.g. CustomerName).
- Add sorting levels (e.g. OrderDate ascending within each group).
3. Group totals and summary fields
You can insert totals at group or report level.
Example: Total OrderAmount per Customer
- Group the report by Customer.
- Select a numeric field such as OrderAmount.
- Click Totals and choose Sum.
- Choose whether the total appears in the Group Footer, Report Footer, or both.
4. Calculated controls in reports
Reports can use expressions to calculate totals or display formatted text.
Examples:
- =Sum([OrderAmount]) – total for group or whole report.
- =”Customer: ” & [CustomerName] – dynamic heading.
- =”Report printed on: ” & Date() – automatic date stamp.
5. Page layout and formatting
- Adjust margins, orientation (Portrait/Landscape) and paper size.
- Use readable, consistent fonts and text alignment.
- Edit report sections:
- Report Header – title or logo.
- Page Header – column headings.
- Group Header/Footer – repeated group titles or subtotals.
- Report Footer – grand totals or closing text.
- Use shading and borders to improve clarity.
6. Labels and mailing reports
The Label Wizard helps print address labels for mailing.
- Go to Create > Labels.
- Select a label manufacturer and size (e.g. Avery).
- Choose fields such as Name, Address and Postcode.
- Arrange them in the preview layout.
- Finish and preview the labels.
7. Exporting reports (PDF and others)
You can export reports for sharing, printing or archiving.
- Open the report.
- Go to External Data > PDF or XPS or File > Export.
- Select a save location and file name.
- Click Publish.
Benefits of PDF: layout preserved, easy to share, secure and widely supported.
8. Practical Activity
- Create a report that lists orders grouped by customer.
- Add a group total and a grand total.
- Use the Label Wizard to produce a sheet of address labels.
- Export one report as a PDF and check that the layout matches the on-screen preview.